In this article, we will learn how to create a chart app in to show some data in the graph using reactJS.
Below are the steps that we will be following,
- Adding chart
- Adding dynamic style
- Finishing the chart
Adding chart
- Create a react app by running the below commands in the command prompt
npx create-react-app my-app
cd my-app
npm start
- Open the project folder and create a folder named components inside the src folder
- Create a folder named, Chart in it.
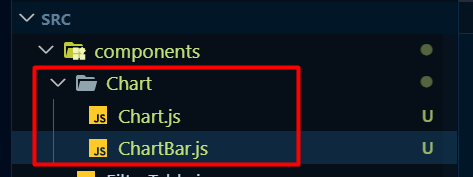
- Create three files (components) in this Chart folder
- Create Chart.js to hold all the components related to the chart in it, and create a file named, ChartBar.js for the bars that will be shown in the chart.
import React from 'react';

const Chart = () => {
    return (
        <div>

        </div>
    );
};

export default Chart;
import React from 'react';

const ChartBar = () => {
    return (
        <div>

        </div>
    );
};

export default ChartBar;
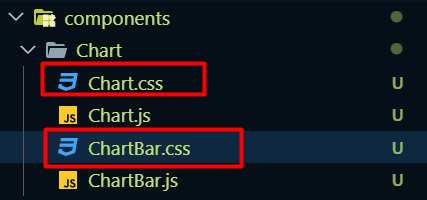
- Create two more files for adding CSS styles in this component. Chart.css and ChartBar.css
- Set up the Chart component to get and pass the data to its child component (ChartBar.js)
import React from 'react';
import ChartBar from './ChartBar';

const Chart = (props) => {
    return (
        <div className='chart'>
            {props.dataPoints.map(dataPoint => <ChartBar />)}
        </div>
    );
};

export default Chart;
Here, we have passed props as an argument to this component, and the data that we will be passing to it; dataPoints; will be an array. And we have run the map method to this dataPoints to render the <ChartBar /> component each time the data array renders. So if there are six objects (data) in the dataPoints array, we will get six, <ChartBar /> component.
- Pass some attributes that will be used in the chart bar.
{props.dataPoints.map(dataPoint => <ChartBar
               key={dataPoint.label}
               value={dataPoint.value}
               maxValue={null}
               label={dataPoint.label}
           />)}
We are passing value, maxValue, and label like an attribute to the ChartBar component. That we are expecting this value will come from this parent. And will receive these values as props in ChartBar component as well.
Adding dynamic styles
- Import all CSS files into their respective component
// in chart.js
import './Chart.css'

// in chartbar.js
import './ChartBar.css'
- Create the div structure to show the chart data in ChartBar.js component and pass an argument as props to this component as well since we have passed some data as attributes to it from its parent component.
import React from 'react';
import './ChartBar.css'
const ChartBar = (props) => {
    return (
        <div className='chart-bar'>
            <div className='chart-bar__inner'>
                <div className="chart-bar__fill">

                </div>
            </div>
            <div className="chart-bar__label">

            </div>
        </div>
    );
};

export default ChartBar;
- Write the below CSS styles into Chart.css and ChartBar.css accordingly,
Chart.css
.chart {
    padding: 1rem;
    border-radius: 12px;
    background-color: #f8dfff;
    text-align: center;
    display: flex;
    justify-content: space-around;
    height: 10rem;
}
ChartBar.css
.chart-bar {
    height: 100%;
    display: flex;
    flex-direction: column;
    align-items: center;
}

.chart-bar__inner {
    height: 100%;
    width: 100%;
    border: 1px solid #313131;
    border-radius: 12px;
    background-color: #c3b4f3;
    overflow: hidden;
    display: flex;
    flex-direction: column;
    justify-content: flex-end;
}

.chart-bar__fill {
    background-color: #4826b9;
    width: 100%;
    transition: all 0.3s ease-out;
}

.chart-bar__label {
    font-weight: bold;
    font-size: 0.5rem;
    text-align: center;
}
- Declare an initial bar fill height in ChartBar.js
const barFillHeight = '0%';
- Check the maxValue that is coming from the parent component. If it’s greater than ‘0’, then convert it to a percentage value and redeclare it to the variable,
    let barFillHeight = '0%';
    // check max value
    if (!props.maxValue) return;
    if (props.maxValue > 0) {
        barFillHeight = Math.round((props.value / props.maxValue) * 100) + "%";
    }
- Add style for the chart bar.
<div className="chart-bar__fill" style={{ height: barFillHeight }}></div>
- Pass the props.label to show the label that we will receive from the parent component,
<div className="chart-bar__label">
               {props.label}
</div>
Finishing the chart
- Import the chart component in App.js file
import React, { useState } from "react";
import Chart from "./components/Chart/Chart";

const App = () => {
  return (
    <div >
      <Chart />
    </div >
  );
}

export default App
- Create an array of objects with labels and values in it and pass this array to the Chart component
import React, { useState } from "react";
import Chart from "./components/Chart/Chart";

const App = () => {
  const chartDataPoints = [
    { label: "Jan", value: 0 },
    { label: "Feb", value: 1 },
    { label: "Mar", value: 2 },
    { label: "Apr", value: 3 },
    { label: "May", value: 4 },
    { label: "Jun", value: 5 },
    { label: "Jul", value: 6 },
    { label: "Aug", value: 7 },
    { label: "Sep", value: 8 },
    { label: "Oct", value: 9 },
    { label: "Nov", value: 10 },
    { label: "Dec", value: 11 },
  ]
  return (
    <div >
      <Chart dataPoints={chartDataPoints} />
    </div >
  );
}

export default App
- Create another array of objects that contains some items which include some dates as well,
const DUMMY_EXPENSES = [
    {
      id: 'e1',
      title: 'Toilet Paper',
      amount: 94.12,
      date: new Date(2020, 7, 14),
    },
    { id: 'e2', title: 'New TV', amount: 799.49, date: new Date(2021, 2, 12) },
    {
      id: 'e3',
      title: 'Car Insurance',
      amount: 294.67,
      date: new Date(2021, 2, 28),
    },
    {
      id: 'e4',
      title: 'New Desk (Wooden)',
      amount: 450,
      date: new Date(2021, 5, 12),
    },
  ];
- Add a dropdown selection in the app component and add a state variable to get the selected date with an onChange() event handler,
const [selectYear, setSelectYear] = useState('')
<div >
     <select onChange={
       e => setSelectYear(e.target.value)
     } className="select select-bordered w-full max-w-xs">
       <option disabled selected>Who shot first?</option>
       <option>2019</option>
       <option>2020</option>
       <option>2021</option>
       <option>2022</option>

     </select>
     <Chart dataPoints={chartDataPoints} />
   </div >
- Now run a filter method to the DUMMY_DATA array so that we can get the items that include the selected year from the dropdown selection.
 const filteredExpenses = DUMMY_EXPENSES.filter((expense) => {
    return expense.date.getFullYear().toString() === selectYear;
  });
This filteredExpenses will return an array.
- Now run a for loop to this filteredExpenses array to get the month and set a new value,
 for (const expense of filteredExpenses) {
    const expenseMonth = expense.date.getMonth(); // starting at 0 => January => 0
    chartDataPoints[expenseMonth].value += expense.amount;
  }
With this, we have run a for loop into the filtered array. And then we separated the month from it and searched the specific data into chartDatapoints array with the filtered month name.
- Pass the datapoints to the Chart component.
<Chart dataPoints={chartDataPoints} />
In the chart component, we are receiving this as props.
- In the chart component, run a map method to the dataPoints array to get the value property; so that the values can be seen in the chart.
 const datapointValues = props.dataPoints.map(datapoint => datapoint.value)
    const totalMax = Math.max(...datapointValues)
Here we have run a map method to the datapoints array and got the values from it. And we are keeping the values in totalMax variable.
That’s about it. Now if we sum up all the components,
App.js
import React, { useState } from "react";
import Chart from "./components/Chart/Chart";

const App = () => {
  const [selectYear, setSelectYear] = useState('')
  const DUMMY_EXPENSES = [
    {
      id: 'e1',
      title: 'Toilet Paper',
      amount: 94.12,
      date: new Date(2020, 7, 14),
    },
    { id: 'e2', title: 'New TV', amount: 799.49, date: new Date(2021, 2, 12) },
    {
      id: 'e3',
      title: 'Car Insurance',
      amount: 294.67,
      date: new Date(2021, 2, 28),
    },
    {
      id: 'e4',
      title: 'New Desk (Wooden)',
      amount: 450,
      date: new Date(2021, 5, 12),
    },
  ];

  const filteredExpenses = DUMMY_EXPENSES.filter((expense) => {
    return expense.date.getFullYear().toString() === selectYear;
  });
  console.log(filteredExpenses)
  const chartDataPoints = [
    { label: "Jan", value: 0 },
    { label: "Feb", value: 0 },
    { label: "Mar", value: 0 },
    { label: "Apr", value: 0 },
    { label: "May", value: 0 },
    { label: "Jun", value: 0 },
    { label: "Jul", value: 0 },
    { label: "Aug", value: 0 },
    { label: "Sep", value: 0 },
    { label: "Oct", value: 0 },
    { label: "Nov", value: 0 },
    { label: "Dec", value: 0 },
  ];

  for (const expense of filteredExpenses) {
    const expenseMonth = expense.date.getMonth(); // starting at 0 => January => 0
    chartDataPoints[expenseMonth].value += expense.amount;
  }
  return (
    <div >
      <select onChange={
        e => setSelectYear(e.target.value)
      } className="select select-bordered w-full max-w-xs">
        <option disabled selected>Who shot first?</option>
        <option>2019</option>
        <option>2020</option>
        <option>2021</option>
        <option>2022</option>

      </select>
      <Chart dataPoints={chartDataPoints} />
    </div >
  );
}

export default App
Chart.js
import React from 'react';
import ChartBar from './ChartBar';
import './Chart.css';
const Chart = (props) => {
    const datapointValues = props.dataPoints.map(datapoint => datapoint.value)
    const totalMax = Math.max(...datapointValues)
    return (
        <div className='chart'>
            {props.dataPoints.map(dataPoint => <ChartBar
                key={dataPoint.label}
                value={dataPoint.value}
                maxValue={totalMax}
                label={dataPoint.label}
            />)}
        </div>
    );
};

export default Chart;
ChartBar.js
import React from 'react';
import './ChartBar.css'
const ChartBar = (props) => {
    let barFillHeight = '0%';
    // check max value
    if (!props.maxValue) return;
    if (props.maxValue > 0) {
        barFillHeight = Math.round((props.value / props.maxValue) * 100) + "%";
    }
    return (
        <div className='chart-bar'>
            <div className='chart-bar__inner'>
                <div className="chart-bar__fill" style={{ height: barFillHeight }}>
                </div>
            </div>
            <div className="chart-bar__label">
                {props.label}
            </div>
        </div>
    );
};

export default ChartBar;
Chart.css
.chart {
    padding: 1rem;
    border-radius: 12px;
    background-color: #f8dfff;
    text-align: center;
    display: flex;
    justify-content: space-around;
    height: 10rem;
}
ChartBar.css
.chart-bar {
    height: 100%;
    display: flex;
    flex-direction: column;
    align-items: center;
}

.chart-bar__inner {
    height: 100%;
    width: 100%;
    border: 1px solid #313131;
    border-radius: 12px;
    background-color: #c3b4f3;
    overflow: hidden;
    display: flex;
    flex-direction: column;
    justify-content: flex-end;
}

.chart-bar__fill {
    background-color: #4826b9;
    width: 100%;
    transition: all 0.3s ease-out;
}

.chart-bar__label {
    font-weight: bold;
    font-size: 0.5rem;
    text-align: center;
}
Previews:
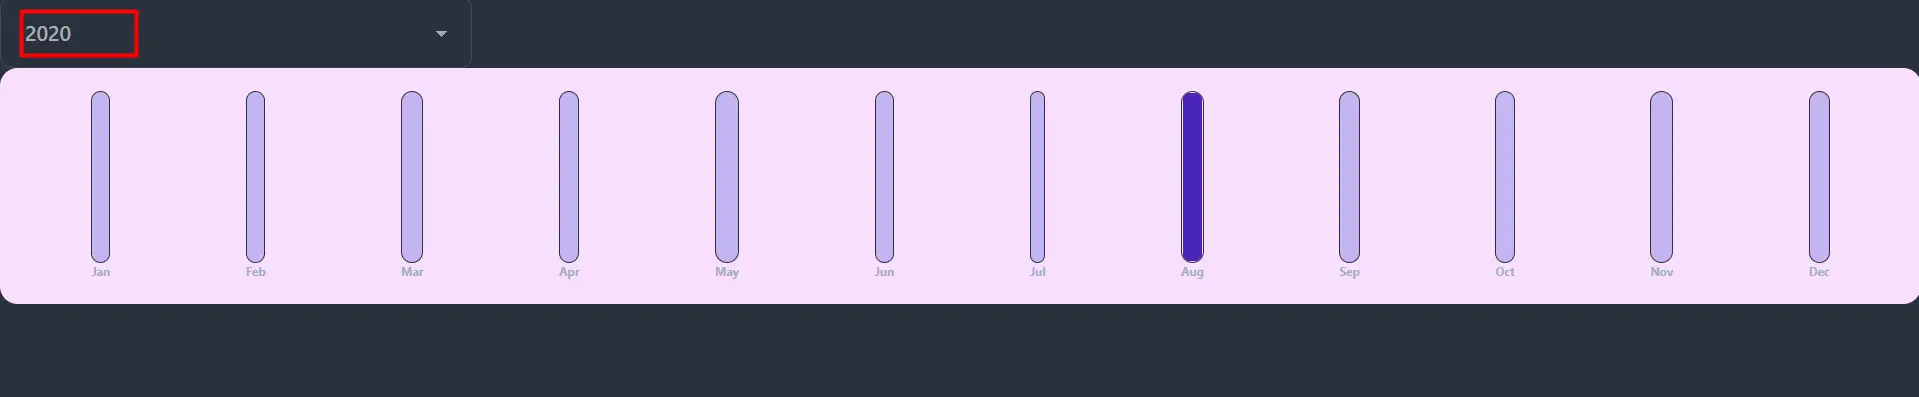
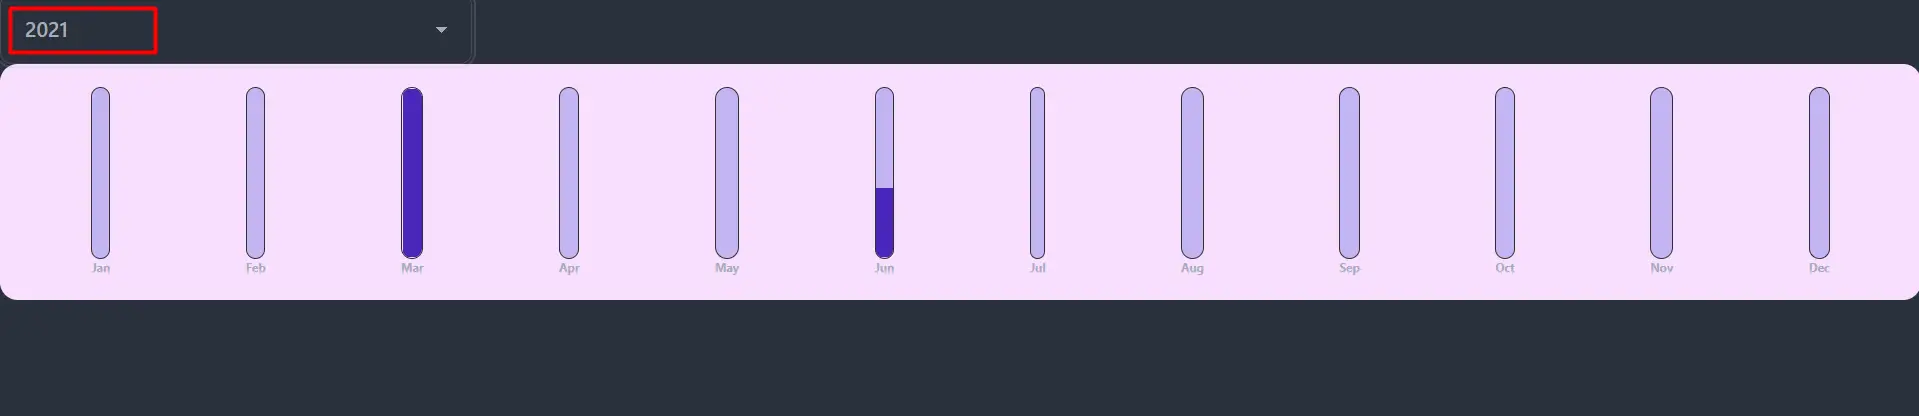
This is how we can create a chart in React js.